Transforming Finance Analytics with Power BI
Introduction
In today's data-driven world, financial departments face an increasing need for real-time, accurate, and insightful analytics to drive decision-making. Power BI, Microsoft's robust business intelligence tool, offers a game-changing solution to meet these demands. This article explores how finance teams can harness the power of Power BI for financial analysis, from data visualization to predictive modelling, enabling organizations to stay competitive and efficient.
1. The Importance of Finance Analytics
Finance analytics involves more than just crunching numbers; it’s about turning raw data into actionable insights. This section explains why analytics is crucial in the finance sector:
Improved decision-making: Through data visualization and trend analysis, companies can spot inefficiencies and opportunities.
Risk management: Power BI helps in identifying potential risks by analysing historical data and trends.
Forecasting & Budgeting: Finance analytics streamlines forecasting processes, allowing organizations to make informed budgetary decisions.

3. Key Features of Power BI for Financial Analysis
This section dives into Power BI features that make it particularly useful for finance analytics:
Data Modelling: Power BI enables users to model financial data from various systems, merging data for comprehensive analysis.
DAX (Data Analysis Expressions): Discuss how to use DAX formulas to perform complex calculations like profitability ratios, revenue growth, or cost analysis.
Power Query for Data Transformation: Explain how finance teams can clean, transform, and prepare their data with Power Query, automating manual processes.
Security & Governance: Highlight features such as row-level security (RLS) to ensure sensitive financial data is only accessible to the right people.
4. Best Practices for Financial Reporting with Power BI
Present tips and best practices for using Power BI effectively in finance analytics:
Design Clean Dashboards: Simplicity is key; finance dashboards should be intuitive and display only essential KPIs (Key Performance Indicators) like revenue, expenses, profit margins, etc.
Use the Right Visuals: Recommend visuals that suit financial data, such as line charts for trends, bar charts for comparisons, and KPIs for quick performance insights.
Automate Reports: Explain how financial analysts can set up Power BI to auto-refresh data and automate reporting processes, reducing manual effort.
Drill-Through Capabilities: Mention how users can employ drill-throughs to explore financial data in more detail without cluttering the main dashboard.
5. Use Cases of Power BI in Finance
Share real-world examples where Power BI has transformed finance departments:
Profitability Analysis: Power BI allows companies to visualize profit margins by product, department, or region.
Cash Flow Management: Financial teams can monitor cash inflows and outflows in real-time, ensuring liquidity is always in check.
Expense Management: Compare and analyse expenses across different time periods, departments, or cost centres to identify trends and control spending.
6. Advanced Techniques: Predictive Analytics in Finance
Explore the advanced functionalities of Power BI that empower finance teams to look beyond the present:
Forecasting Models: Show how Power BI’s built-in forecasting tools can predict future revenue, sales, or expenses.
Integration with Machine Learning: Discuss how Power BI can integrate with Azure Machine Learning to run predictive models directly from the dashboard, providing more accurate financial forecasts.
Scenario Analysis: Demonstrate how finance teams can create different scenarios to analyse the potential outcomes of various business decisions (e.g., impact of price changes, new product launches).
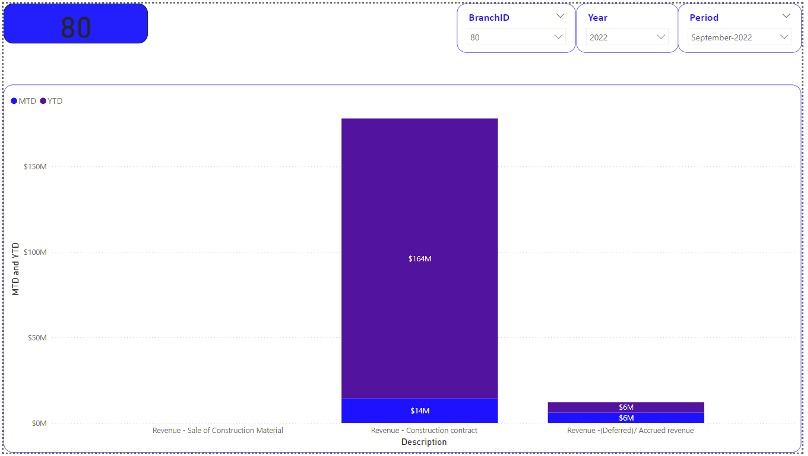
Example on Revenue
7. Challenges and Considerations
No tool is perfect. This section could touch on common challenges finance teams face when adopting Power BI:
Data Quality: Discuss how poor data quality can lead to inaccurate reports and how to ensure clean, reliable data sources.
User Training: Finance professionals might require training to effectively use Power BI’s advanced features.
Licensing and Costs: Offer insights into Power BI’s licensing structure and how to plan a cost-effective implementation.
8. Conclusion
In conclusion, Power BI offers a powerful, flexible, and scalable solution for finance teams seeking to optimize their financial reporting and analytics. By leveraging Power BI’s robust features, finance departments can gain a deeper understanding of their data, make data-driven decisions, and forecast with precision.
Connect with us now to explore how data can drive growth and innovation in your industry.