Port Operations with Power BI: Drive Efficiency and Reduce Costs
In the competitive world of port operations and shipping logistics, efficiency and real-time decision-making are crucial to success. Managing large-scale shipping terminals, handling diverse cargo, and ensuring seamless transportation require leveraging the latest data-driven solutions.
That’s where Power BI comes in—a cutting-edge business intelligence tool that helps port operators make smarter decisions, streamline operations, and reduce costs.
Why Power BI for Port and Shipping Operations?
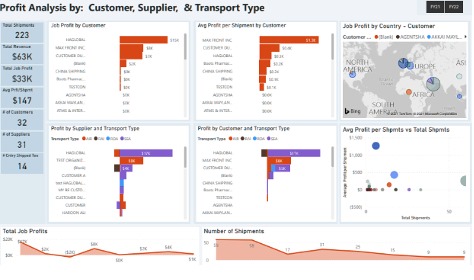
Port operations generate vast amounts of data every day—cargo throughput, vessel schedules, equipment performance, fuel consumption, and much more. Without the right tools, much of this data remains underutilized, potentially leading to inefficiencies and missed opportunities for cost savings. Power BI empowers port authorities and shipping companies to turn this data into meaningful insights, helping to optimize every aspect of operations, from vessel turnaround times to equipment maintenance.
Here’s how Power BI can enhance port and shipping system management:
1. Real-Time Vessel Tracking and Operations Monitoring
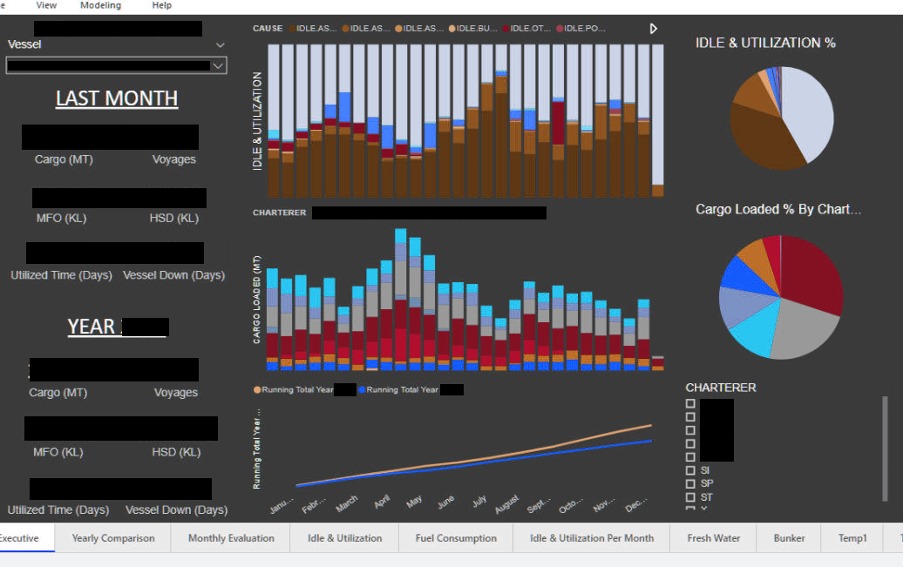
In port operations, real-time visibility of vessel locations, berthing schedules, and cargo handling is essential. Power BI can integrate multiple data sources—such as vessel tracking systems, terminal management software, and weather reports—into a unified dashboard. This real-time monitoring enables operators to optimize berth assignments, reduce idle times, and ensure smooth cargo loading and unloading.
Example: A major port used Power BI to track vessel movements, minimizing berthing delays and increasing overall port efficiency by 10%.
2. Equipment Utilization and Predictive Maintenance
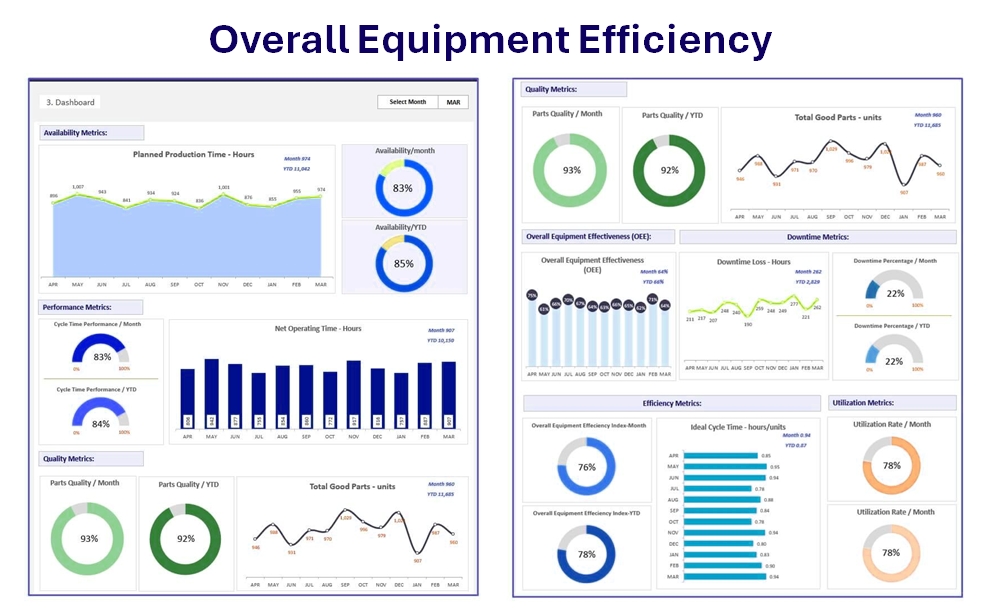
Ports rely heavily on equipment such as cranes, container handlers, and transport vehicles to manage operations efficiently. Monitoring the utilization and maintenance of this equipment can prevent costly breakdowns and minimize downtime. Power BI allows port operators to visualize equipment performance, schedule maintenance based on real-time usage data, and forecast future equipment needs using predictive analytics.
Example: By implementing Power BI for equipment monitoring, one port reduced crane downtime by 15% through predictive maintenance, optimizing both cost and operational continuity.
3. Optimizing Cargo Throughput and Port Capacity
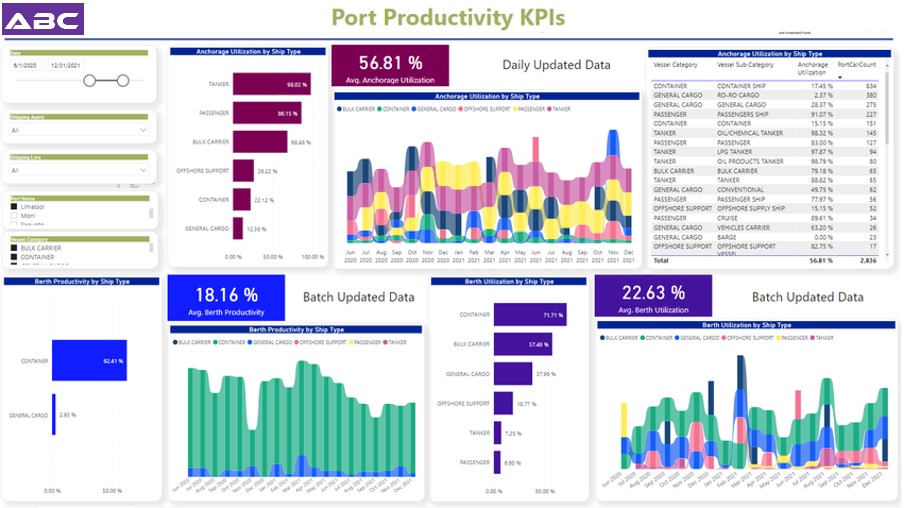
Maximizing port capacity and cargo throughput is essential to stay competitive in the shipping industry. Power BI’s data visualization capabilities can help operators track cargo movement, container dwell times, and space utilization within terminals. With real-time insights into cargo flow, operators can make data-backed decisions to optimize storage, reduce bottlenecks, and improve turnaround times.
Example: A leading port authority used Power BI to visualize container dwell times and improve terminal management. As a result, they were able to reduce congestion and process 20% more cargo during peak seasons without additional infrastructure.
4. Reducing Costs Through Route and Resource Optimization
Operational costs in port logistics can quickly add up—whether from fuel consumption, labour costs, or inefficient resource allocation. Power BI can help ports optimize shipping routes, allocate resources effectively, and analyze operational costs in real time. By identifying areas of inefficiency, port operators can reduce fuel consumption, minimize labour waste, and improve overall profitability.
5. Improving Compliance and Safety Measures
Port operations require adherence to strict safety regulations and environmental standards. With Power BI, you can create customized dashboards to monitor compliance metrics in real time, ensuring that your port meets all regulatory requirements. From monitoring hazardous cargo to tracking emissions levels, Power BI helps maintain safety while minimizing the risk of non-compliance penalties.
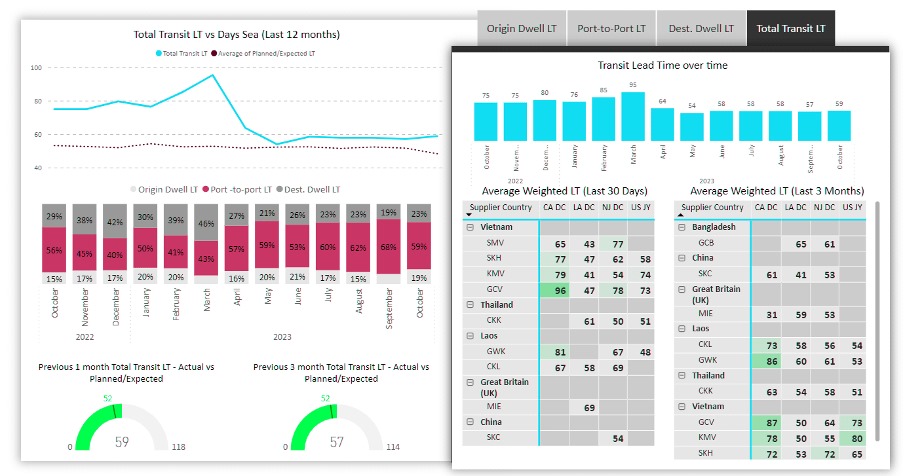
6. Forecasting Future Trends and Expansion Needs
Power BI’s advanced analytics capabilities enable port operators to forecast future trends based on historical data, helping to plan for expansions, allocate resources effectively, and stay ahead of market changes. By identifying patterns in cargo volumes, vessel traffic, and terminal usage, operators can anticipate peak periods and manage capacity accordingly.
Example: Leveraging Power BI’s predictive analytics, a port authority accurately forecasted a surge in container traffic during the holiday season, allowing them to scale operations efficiently and avoid congestion.
How to Get Started with Power BI for Port Operations
Getting started with Power BI for port operations is simple, even for non-technical users. Its intuitive drag-and-drop interface allows you to build custom dashboards and reports quickly, offering seamless integration with your existing port management systems. From tracking real-time cargo movements to optimizing resource allocation, Power BI empowers you with the insights you need to make faster, more informed decisions.
If your goal is to:
· Enhance operational efficiency
· Reduce operating costs
· Improve safety and compliance
· Increase cargo throughput
· Plan for future growth
Power BI is the solution you’ve been waiting for.
Contact us today to learn how Power BI can be tailored to meet the unique challenges of your port and shipping operations. Whether you're managing a regional port or a major international terminal, Power BI can unlock the hidden potential of your data and drive operational success.

